Maps are crucial to applications which need to highlight specific regions, places, or areas where services are available. When it comes to the development of such map features in applications, we often prefer to use Google Maps API, which nearly five-million sites worldwide leverage.
However, when it comes to visualizing regions on a map, you may need to diverge away from a classic Google Maps solution in favor of something more animated or visually striking. We thus look for other Maps solutions, either made available through Drupal contributed modules or other SPA’s to help with this visualization, while keeping the number of libraries and code needed to a minimum.
In several instances at Digital Polygon, we have made use of SVG maps designed to show the map in a more visual, interactive, and minimalist manner using SVG, CSS, JavaScript and Twig as needed.
Implementation in Drupal with twig
For the ideal scenario where we just need to add an SVG map into our component, we can simply add a twig file which contains the SVG code for the map. I will show this based on a Storybook implementation that we recently did on a project.
Folder Structure
For this case we will use storybook folder structure to demonstrate the flow.
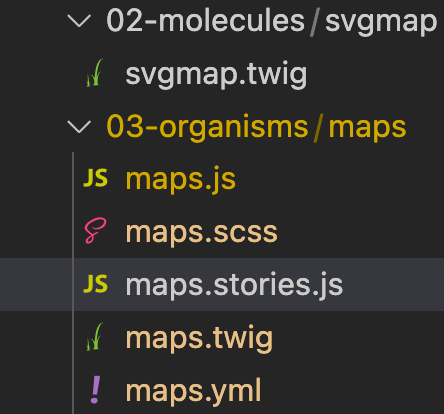
From the structure seen in the image above:
-
We have a molecule named
svgmap.twig. -
In the second folder we have an organism named
mapswhich comprises of a twig file, Scss file, YML and stories file. -
We shall take a deep dive into each of them to better understand the mapping between each.
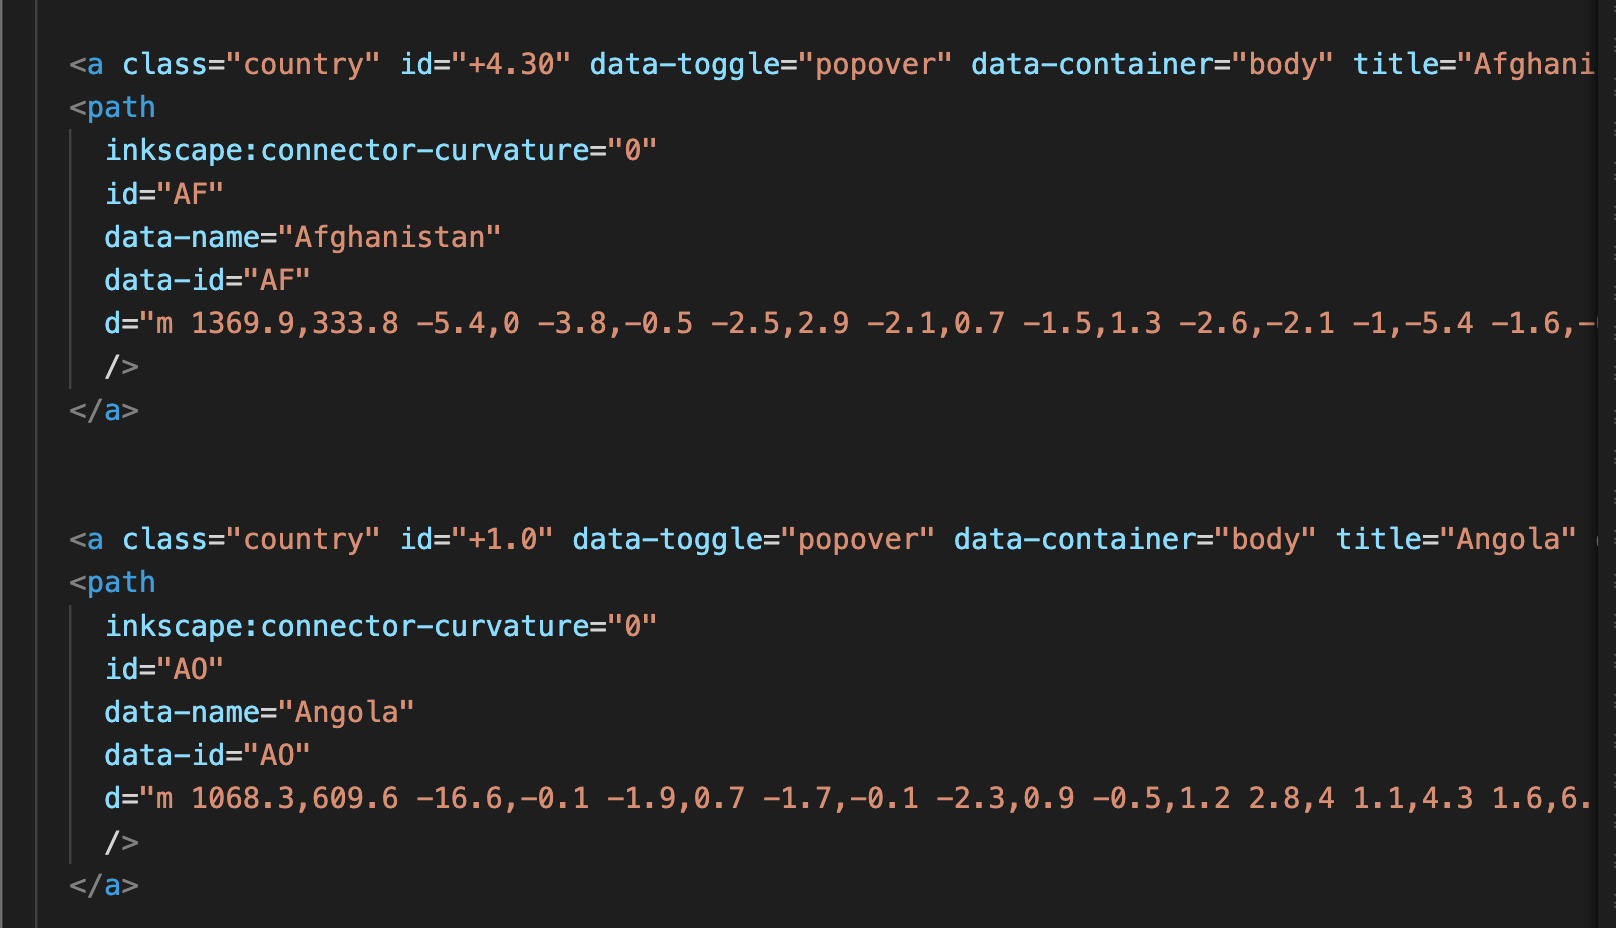
Molecule -> svgmap.twig
This file comprises of the SVG map with all the country pinpoints in it of each country and has specific ID’s which corresponds to each country.
Organism → maps → map.twig
This file consist of SVG map defined in molecules and the name of all the countries defined in the YML file or Drupal system.

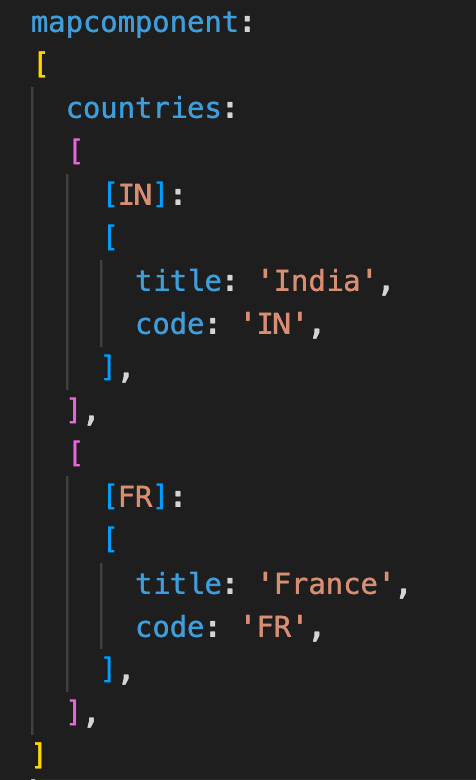
Organism → maps → map.yml
This contains the schema of the list of the countries within an array of countries where each key is the country name which makes it easily readable.
Organism → maps → map.scss
This contains the basic styling to set the SVG map to center-align it and setting the default color of map to grey and adding blue color to the countries which are there in the list (YML/Drupal system).
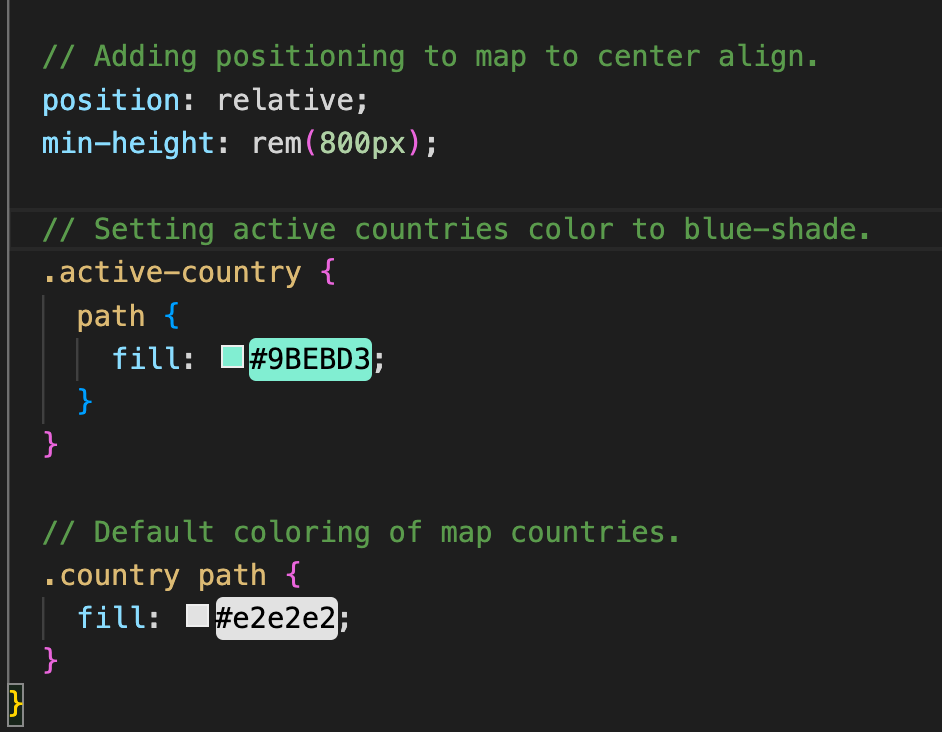
Organism → maps → map.stories.js
This is the part of storybook where we are passing a YML file which was created to the twig file, which acts as a style guide to the storybook. This file consists is a mapping between a twig and a YML data.

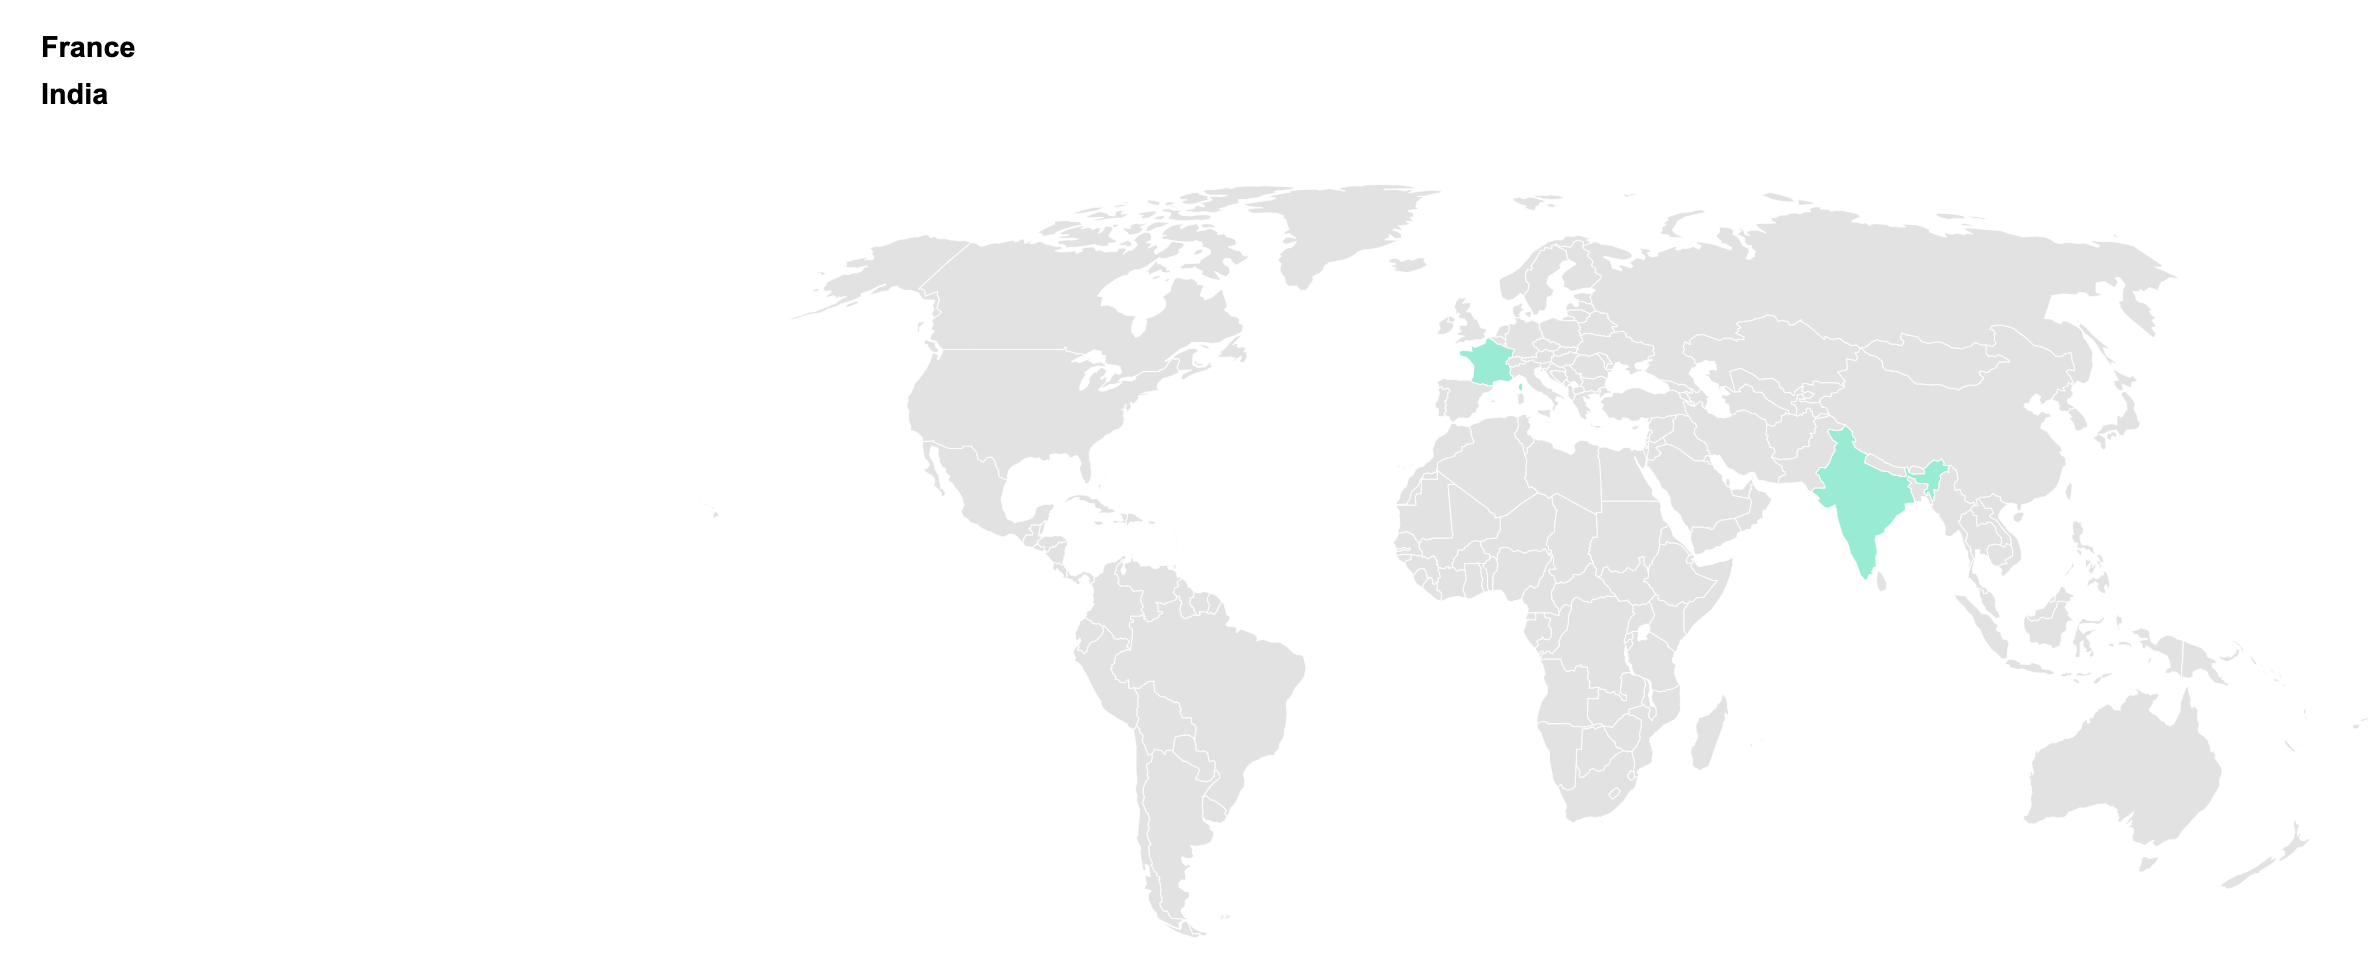
The end result looks something like the below image, where the highlighted area consists of the data coming from YML, and the left side consists of the list of countries.
Summary and Conclusion
If the map we need to display is simple in nature, consisting of a handful of polygons and colors, then an SVG map can be a good way to go. You can implement it using a handful of Twig files in your theme or module, with minimal JavaScript needed.
For more info you can integrate the code here into your Drupal system or use it in any application. - GitHub - sibStephen/svg-with-map-twig: Code snippet demonstrating, SVG Map with twig in Drupal with storybook syntax.


